

How to start with Power BI Desktop
This part of blog is for a people who never had contact with programming or Power BI. I’m want to show you that is impossible understanding this amazing tools without knowledge about programming. In these place I will teach you step by step how to understanding, start using, and have fun with Power BI.
So let’s start
First you should know that at these moment we have three kind of Power BI:
Power BI Desktop it makes us connect to data, shape that date and the last we can use that model to create reports. You can save your work in Power BI Desktop file format. Files will be shared like any other file.
Power BI Service where you can share your report with another people, publish report and get access your date anywhere.
Power BI Mobile here you can connect you data and monitoring your business by phone.
Ready…Steady…Go…
At the moment we will be using Power BI Desktop. In these post I will show you how to installing Power BI Desktop in your machine.
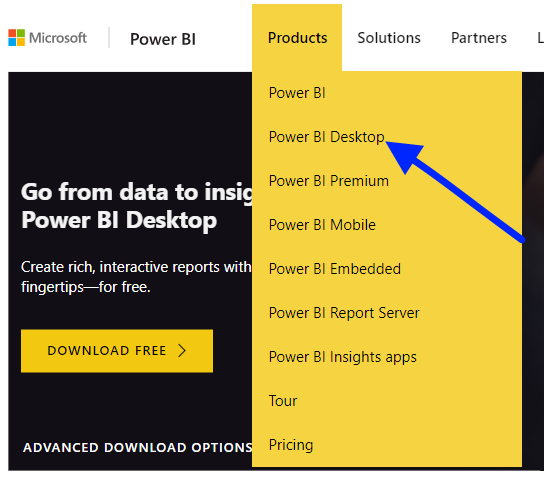
In first step you should installing Power BI application on your machine. Free version MS Power BI Desktop you can find here.
 In this step, you can register, however, it’s not necessary as long as you use only Power BI Desktop not publishing reports to the Portal.
Using Power BI Desktop
When you download and install Power BI Desktop – first what you will see is Welcome window.
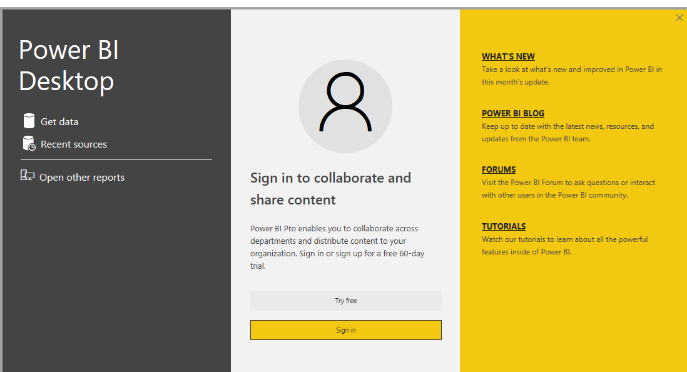
In the Welcome screen you can directly Get Data, see Recent Sources and Open Other Reports. When you close the window the Report view of Power BI Desktop is displayed.

After opening the BI power we will be presented with a ribbon with three tabs:
Home – we will find here the most important for us options such as: Get data, enter data, edit queries
View – we can adjust the size of the report to display in the phone, set the position of the page,
Modelling – allows you to format data, add columns, tables, sort etc
The following screen shows the three view icons along the left of Power BI Desktop:
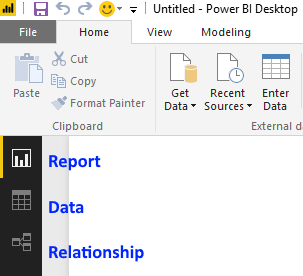
Report – we can see here the final process of loading data in the form of graphs. Reports may appear on one or several pages.
Data – there is a table with downloaded data, which can be appropriately changed, formatted, to selected charts. These data can come from many sources of Excel, SQL Server, Internet etc
Relationship – we find here a full data model including links between data tables.
Visualizations
On the right-hand side we can see the visualizations panel where are the types of graphs in Power BI, as well we can formatting and model data from the field bar.
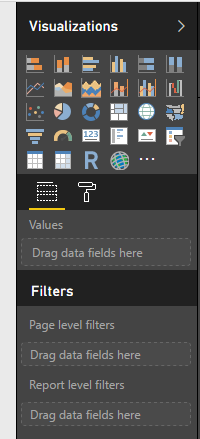
Visualizations bring your report to life. Thanks to them you can create amazing and completing visual presentations. Below, I describe a list of available out of the box visualizations in Power BI. You can add them to report simply by click.
Visualizations available in Power BI:
- Line charts,
- Maps:Basic maps,
- Maps: Filled maps,
- Donut charts,
- Pie charts,
- Scatter charts,
- Combo charts,
- Area charts,
- Line and stacked column chart,
- Line and clustered column chart,
- Waterfall chart, 100% Stacked column chart,
- 100% Stacked bar chart,
- Clustered column chart,
- Clustered bar chart,
- Funnel charts,
- Gauge charts,
- Card charts,
- Multi – row card,
- KPIs,
- Slicer,
- Tables charts,
- Matrix charts,
- Bubble charts.
I will show you more details about how to use the most popular charts in the future posts.
The next post will be about creating a model and ingestion it in Power BI.
About author

You might also like

Getting the Data to Power BI
Welcome to the next post regarding Power BI. This time, we will know Power BI from the more pleasurable side – that is, it will be practically and conveniently. Namely,

Installation and setting up Power BI Gateway
In this short post, I will show you step by step on how to install two different modes of a Power BI Data Gateway. What is it this Data Gateway?

Starting from zero – Temporal tables, part 3
Today I would like to show how to implement temporal table solution when you have an existing table already present in the database. But this will not be all you


0 Comments
No Comments Yet!
You can be first to comment this post!